Overview
4 sensors
4 sensors
7 sensors
10 sensors (borrowed)
Infrasound Array 1
Specifications
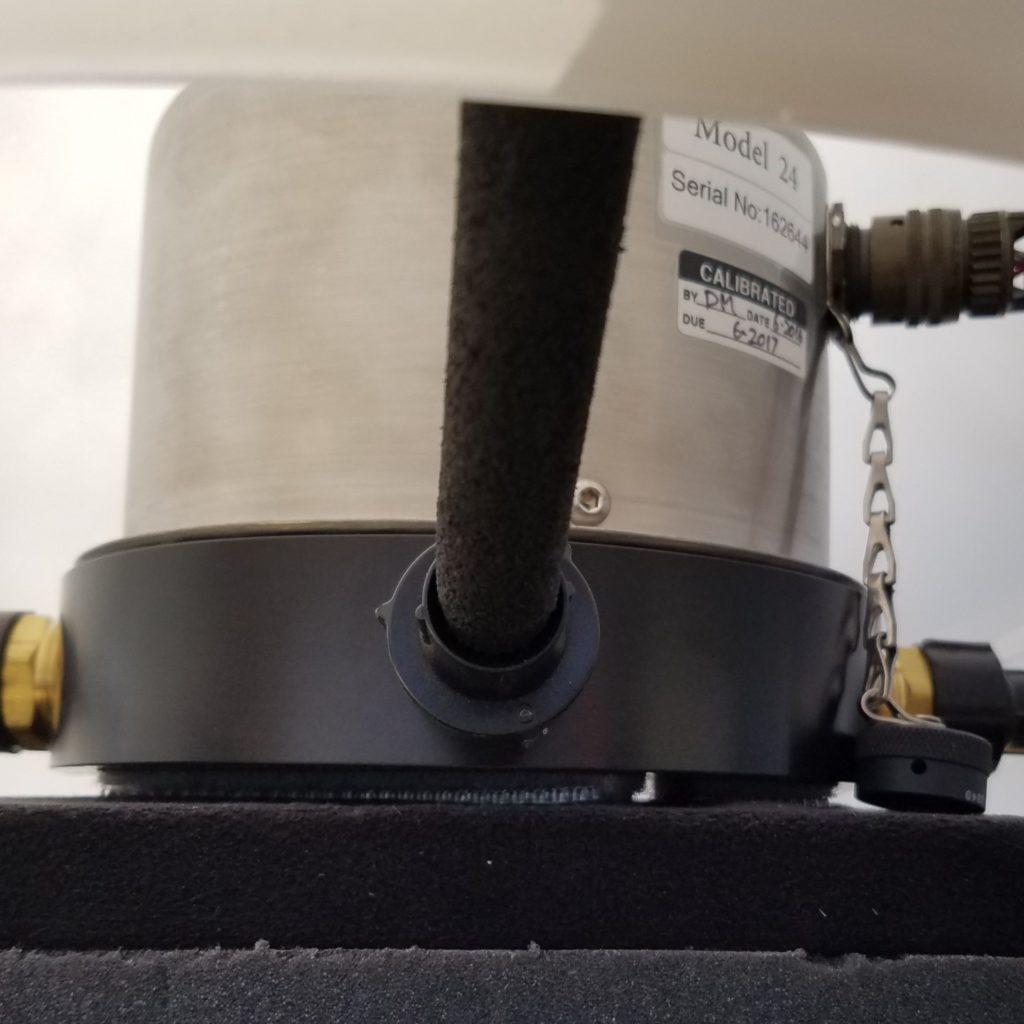
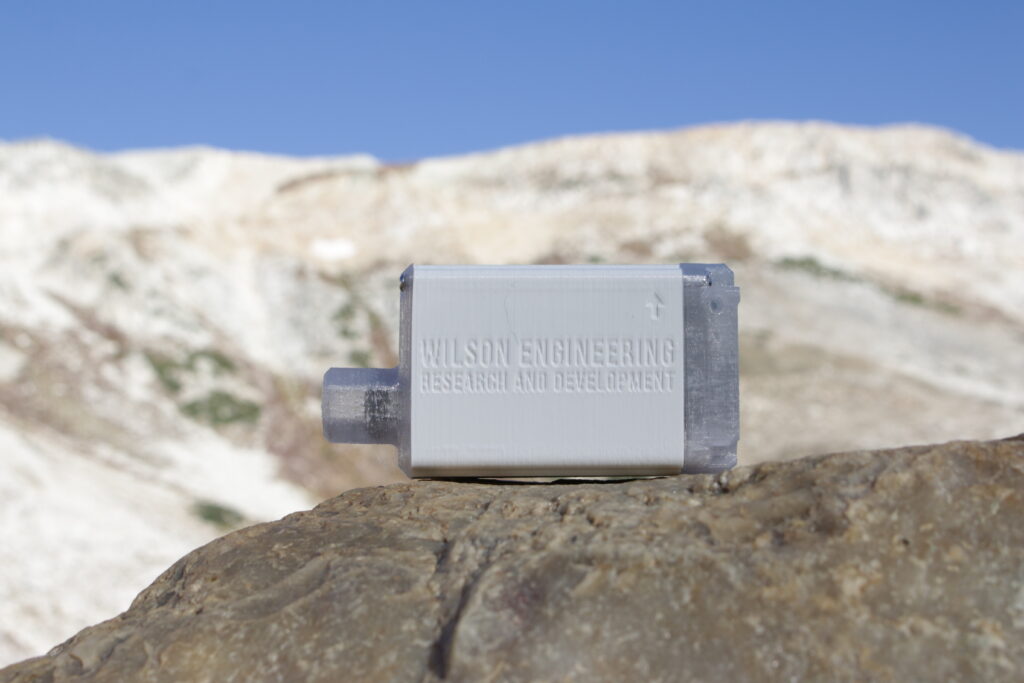
- 3 microphone (model 24, Chaparral Physics) array
- Used for long term deployment at Oklahoma State University (OSU) from Jan 2017 until 2023
- Each microphone was ~60 m from each other microphone
- Microphone nominal sensitivity: 400 mV/Pa
- Single reference microphone still in operation
Description
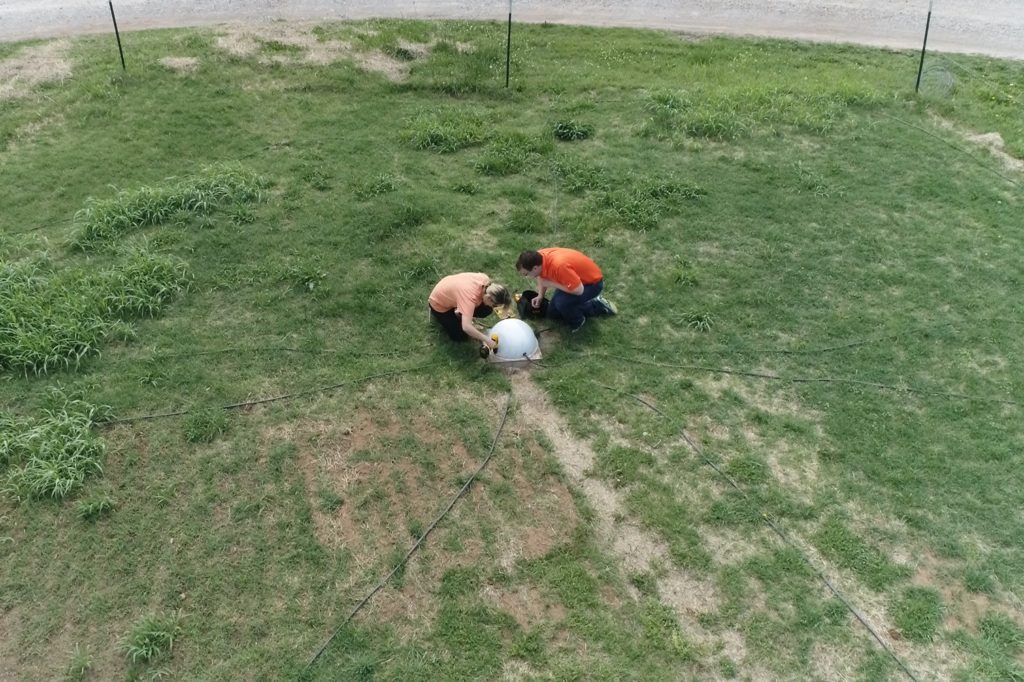
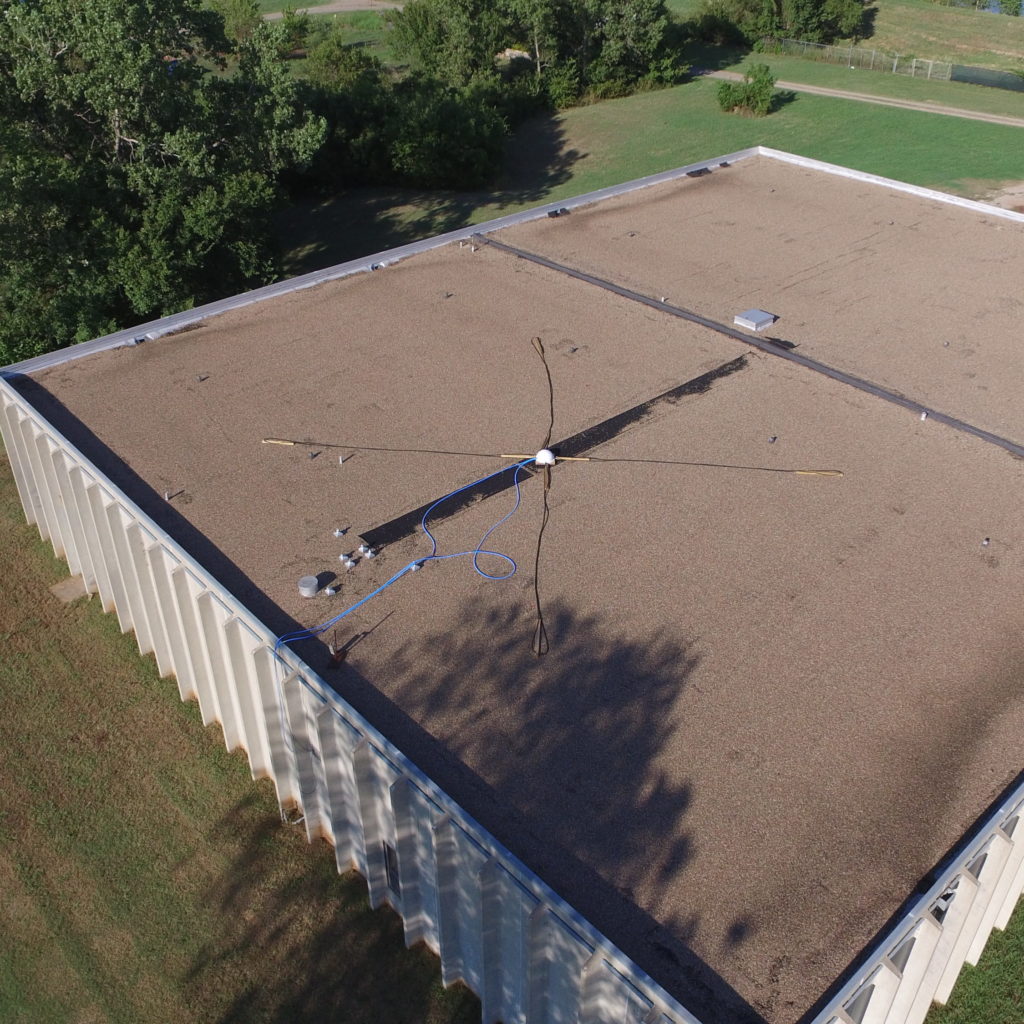
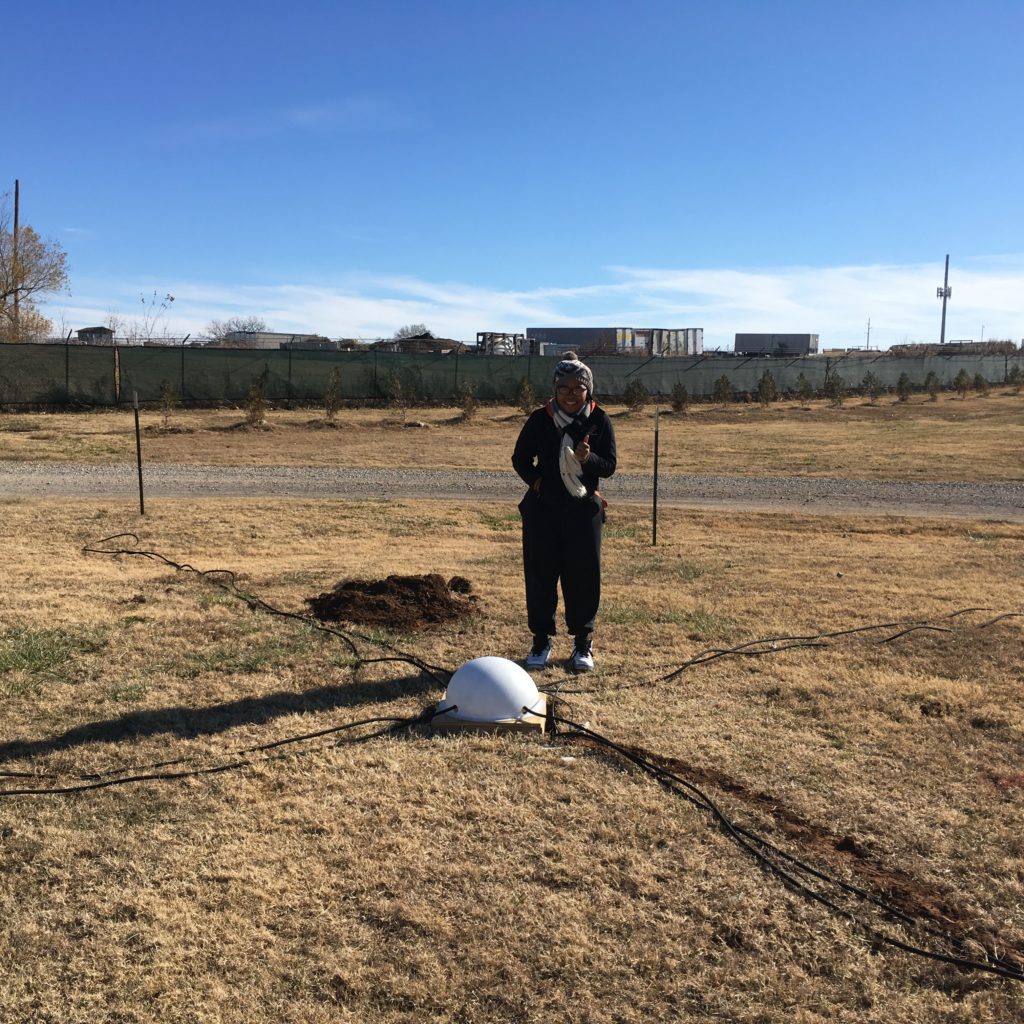
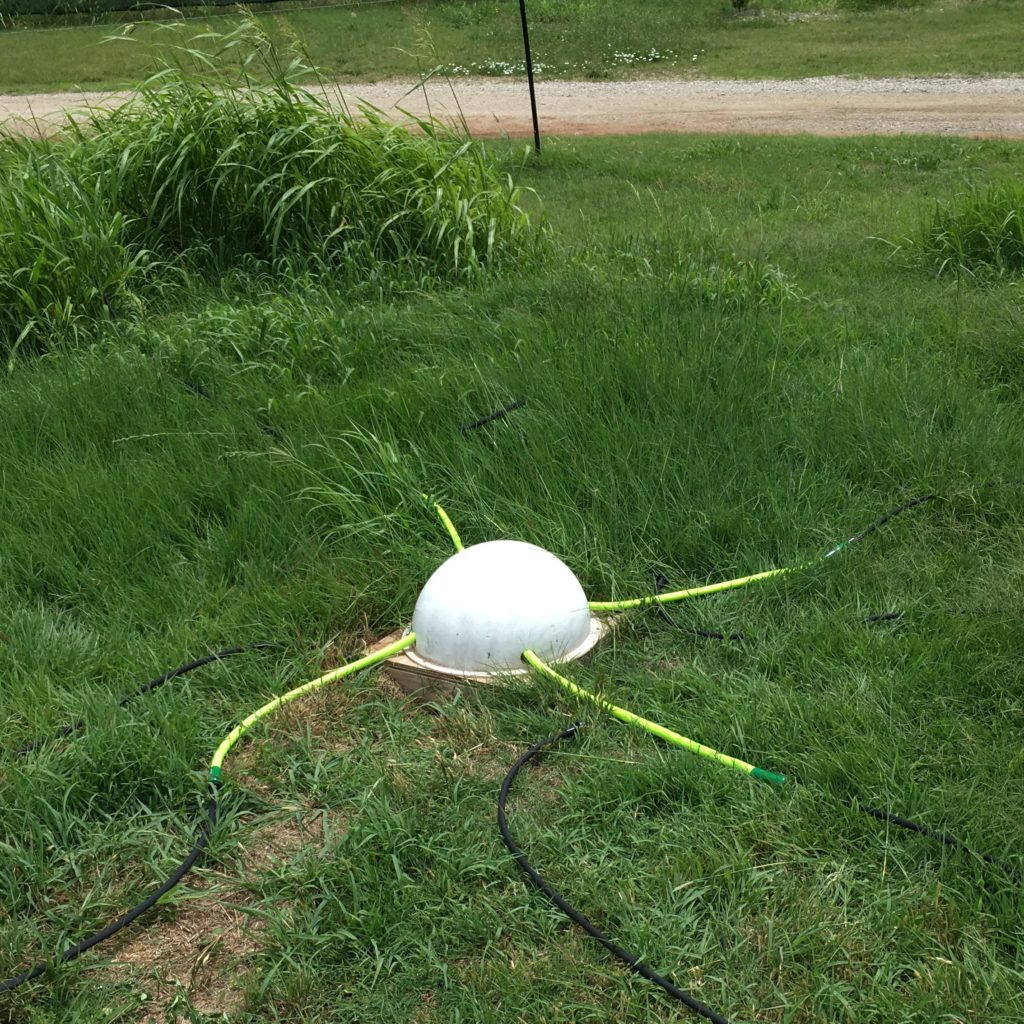
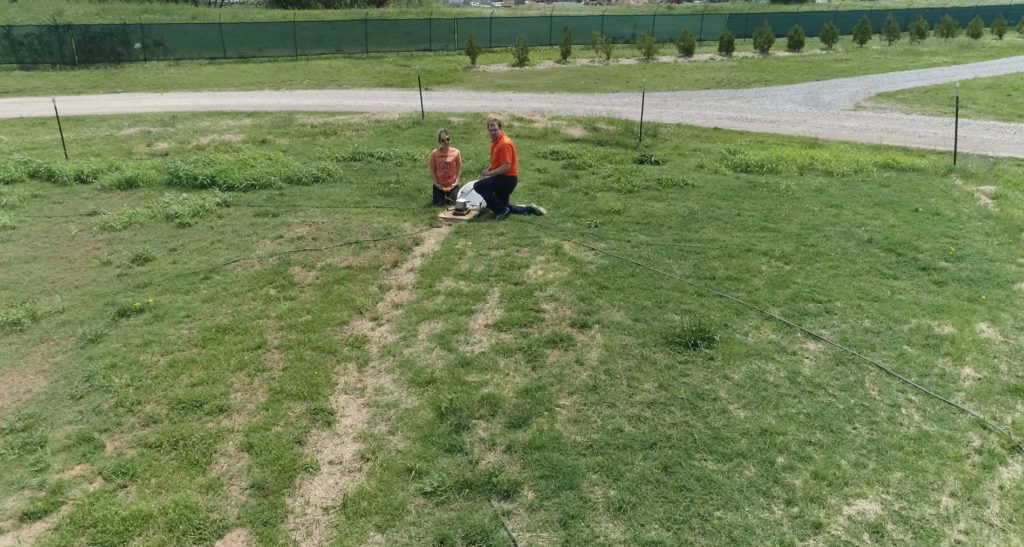
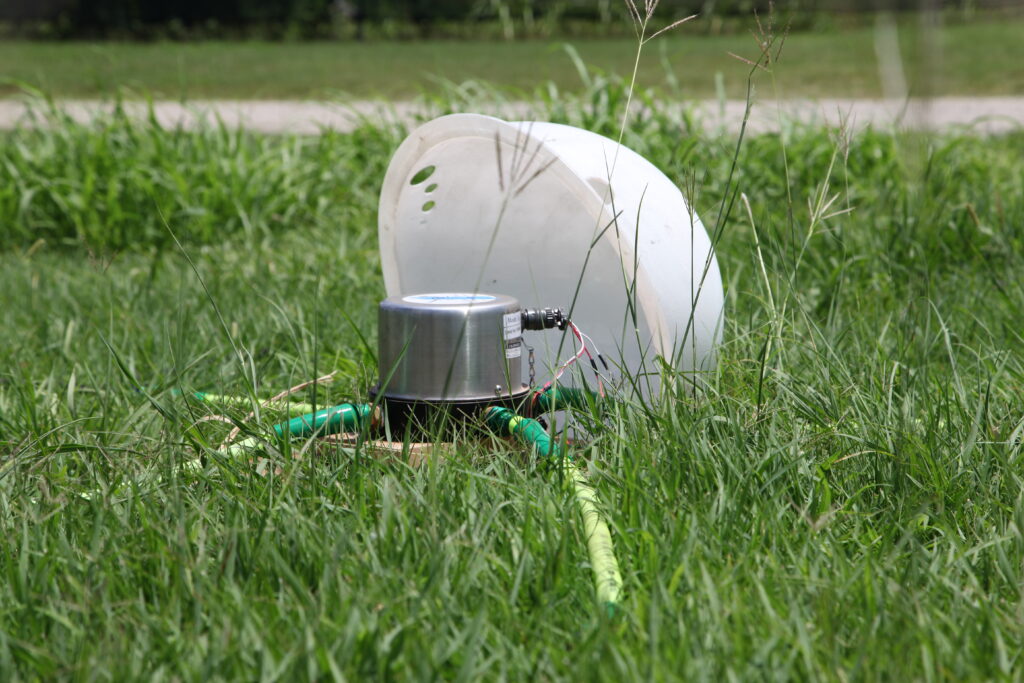
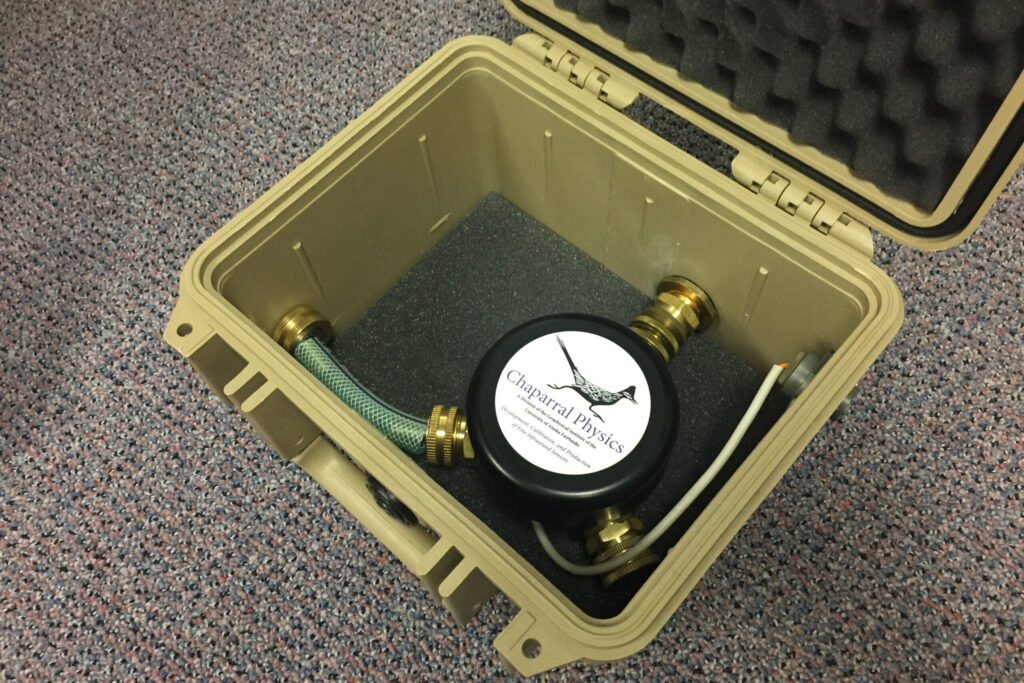
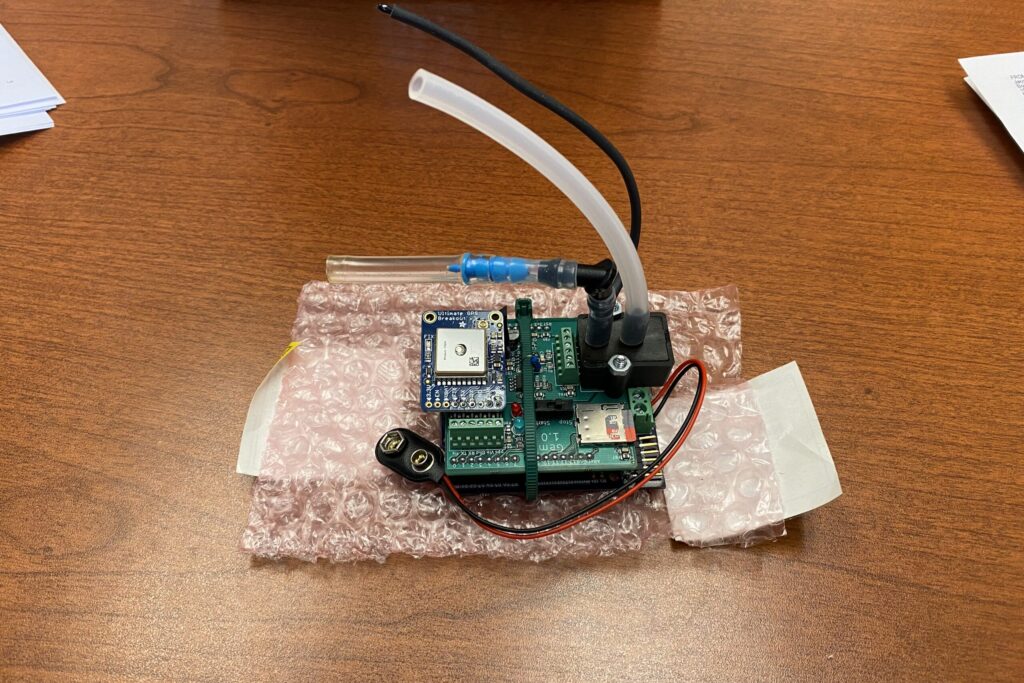
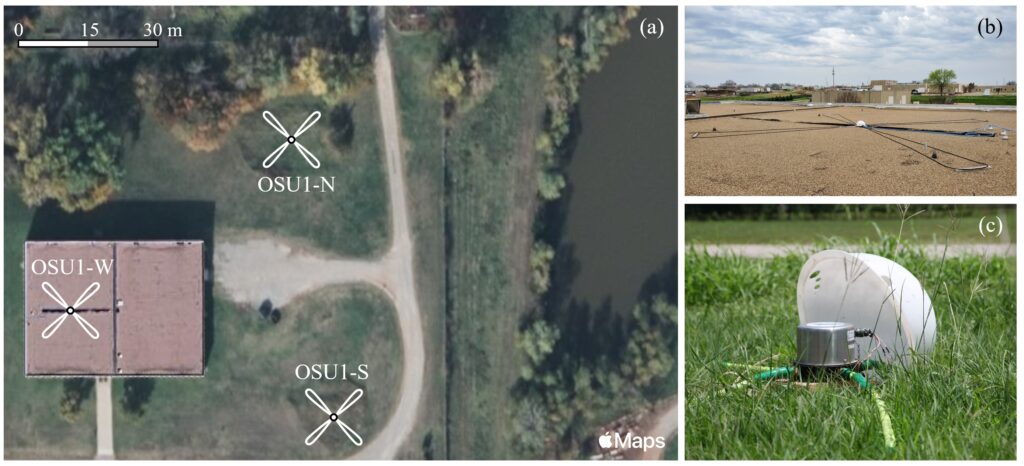
A 3-microphone (Model 24, Chaparral Physics) infrasonic array was deployed on the campus of Oklahoma State University (OSU) starting on January 11, 2017. This deployment was part the NSF-funded Collaboration Leading Operational UAS Development for Meteorology and Atmospheric Physics (CLOUD-MAP) project. The infrasonic array is centered at (36.1344, -97.0815) with microphone 1 located on a building roof (36.1344, -97.0819) and the other two (microphone 2: 36.1342, -97.0812; microphone 3: 36.1347, -97.0814) located at ground level. This places the distance between microphones 1-2, 1-3, and 2-3 at 67.6 m, 58.6 m, and 58.5 m, respectively. Each microphone has a nominal sensitivity of ~400 mV/Pa and a nearly flat response from 0.1-200 Hz. All the microphones had identical mounting structure that included a low-frequency vibration isolation pad with the microphone sealed within an acrylic dome painted white. Windscreens were produced using four 15-m long porous hoses connected to each microphone for spatially averaging to cancel out incoherent noise (e.g., wind). The microphones are powered with DC-power supplies (APS-1303, Aktakom). The output from each microphone is recorded via a dynamic signal analyzer (USB-4432, National Instruments). The data acquisition is controlled via a commercial software package (Sound & Vibration Measurement Suite, National Instruments) and sampled at a fixed 1 kHz rate. Measurements are grouped in 20 minute observation windows.
Noise Model
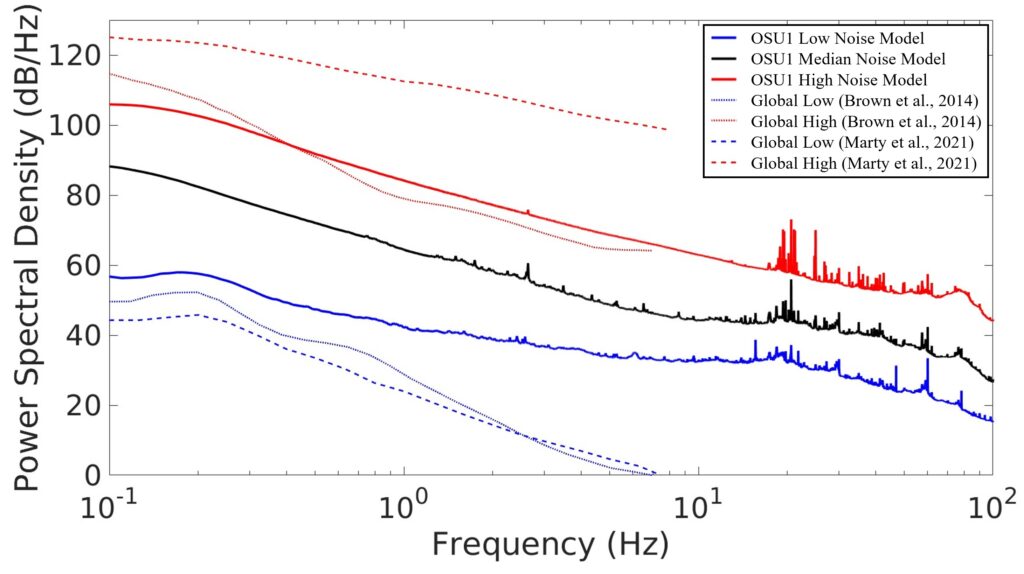
A station noise model is a critical component in the evaluation of the data quality and is a useful tool in estimating the detectability of signals at specific frequencies and amplitudes. Using the history of ambient noise (i.e., energy not associated with a source of interest) at a specific station, its noise model can be readily defined based on the Probability Distribution Function (PDF) of the Power Spectral Density (PSD) over a defined period of interest. The PDF was formed from 1-h average PSDs for every hour that OSU1 was operational. Each average PSD was produced using the Welch method with 100 s windows and 50% overlap. Then, the OSU1 low and high noise models were defined as the 5th and 95th percentiles of the PDF, respectively. The resulting low, median, and high noise models were produced. The use of the noise model at higher frequencies should be carried out with caution as the 1-h period would produce a poor representation of the PDF at these frequencies.
Documentation
Arnesha Threatt (2016) “Investigation of natural and anthropomorphic sources of atmospheric infrasound,” M.S. Thesis, Oklahoma State University, Stillwater, USA.
TC Wilson, CE Petrin & BR Elbing (2023) “Infrasound and low-audible acoustic detections from a long-term microphone array deployment in Oklahoma,” Remote Sensing, 15(5), 1455-23.
Images